Hello Everyone, In this Salesforce unit I am going to describe Report and their types in Salesforce that helps you to provide a clear view about the report. In this post, all report types are described properly and also provide step-by-step process to create a simple tabular report.
After completing this unit, you’ll able to understand:
- What is a Report?
- Types of Report.
- Step to create a Report.
What is a Report?
A report in a list of records that shows Salesforce object records that meet the criteria you define. In the report, records are displayed in rows and column and can be filtered, grouped, or displayed in a graphical chart.
In Salesforce, every report is stored in a folder that can be public, hidden, or shared, and can be set read-only or read/write. The access of folder contents can be control through roles, permissions, public groups, and license types. Report folder can make available for entire Salesforce organization, or make it private so that only the owner has access folder content.
Salesforce Reports provide a clear picture of an organization to management. Reports play a crucial role to track progress towards various goals, such as expenditure, revenue, profits. In Salesforce we can easily generate reports and also schedules them.
Types of Report
In Salesforce, there are four types of report formats,
1. Tabular Report: It’s a simplest and fastest way to present your data without any subtotals. Tabular report very similar to a spreadsheet that contains an ordered set of fields in the column with matching record listed in a row.
Example: List of Accounts, List of Contacts etc.
2. Summary Report: This report provides a list of records with grouping and subtotals. It’s very similar to the tabular report. If you want to calculate subtotals based on the value of a particular field or want to create a group report, Summary report there for you.
Example: All Opportunity grouped by Sales stage.
3. Matrix Report: This report format allows you to group records both by row and by column. Because an awesome feature to provide the most detailed view of your data, these reports are most time-consuming. If you want to see data by two different dimensions that aren’t related like date and product, you have to use matrix report.
Example: List of summarized opportunities by month vertically and by account horizontally.
4. Joined Report: This report used to create different views of data from multiple reports types, Maximum reports blocks to display from different types of related data is Five (5). In Joined report format each block can have own columns, summary fields, formulas, filter, and sort order.
Example: Joined report to show opportunity, activity, and case data from Account object.
Steps to create a Report
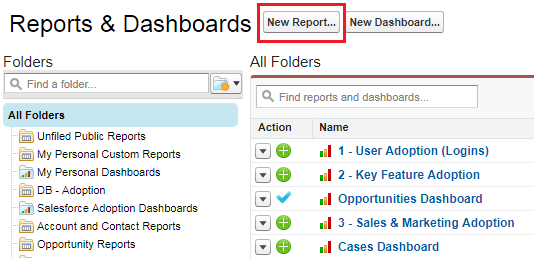
Step 1: Click on Report Tab.

Step 2: Click on the New Report button.
Step 3: Select Report Type and then click on the Create button.
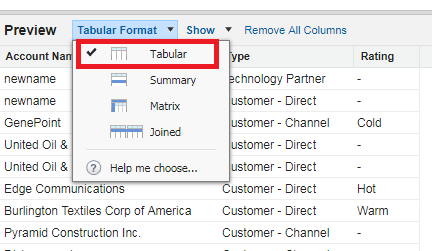
 Step 4: Select Format, In my case I have selected tabular format.
Step 5: Select a column from Left Side Pallete, then drag & drop in Report Preview Pallete.

Step 6: Click on Save button to save the report.

Step 7: Fill the Name of Report and select Folder in which you want to save your report and then click on Save and Run Report button.

Now, you can see the data of your report.

See also:
Steps to create a Report
Step 1: Click on Report Tab.
Step 6: Click on Save button to save the report.
Step 7: Fill the Name of Report and select Folder in which you want to save your report and then click on Save and Run Report button.
Now, you can see the data of your report.
See also:
Conclusion:
Hope you like this tutorial, for any query and suggestion please feel free to comment.
Thank you.
1 Comments
Great post! Reports are essential for turning raw data into meaningful insights—helping teams track performance, monitor KPIs, and make informed decisions. I appreciate how you explained different report types and customization options. For those planning to switch platforms, it's also crucial to migrate data from Salesforce to Zoho CRM properly, including reports and dashboards, to maintain continuity in analytics and business visibility. Thanks for the valuable overview!
ReplyDeletePost a Comment